
All figures (19)
 Figure 11. Longitudinal decay in maximum mean total pressure and total pressure fluctuation.
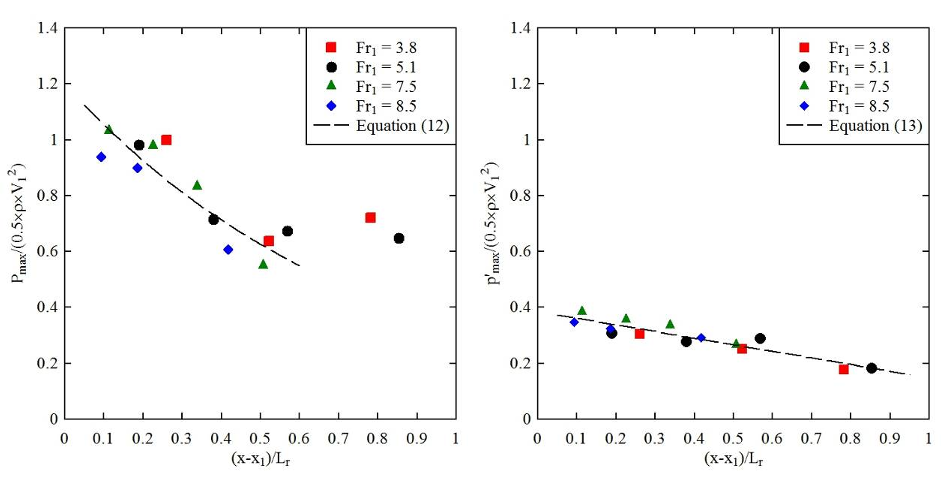 Figure 10. Vertical distributions of mean total pressure (a1 – a4, left) and total pressure fluctuations (b1 – b4, right).
 Figure 12. Comparison between characteristic elevations of maximum mean total pressure YPmax, maximum total pressure fluctuation Yp’max, maximum bubble count rate YFmax and maximum interfacial velocity YVmax.
 Figure 13. Comparison between relative total pressure fluctuation and square of turbulence intensities for raw and high-frequency signals in the turbulent shear region.
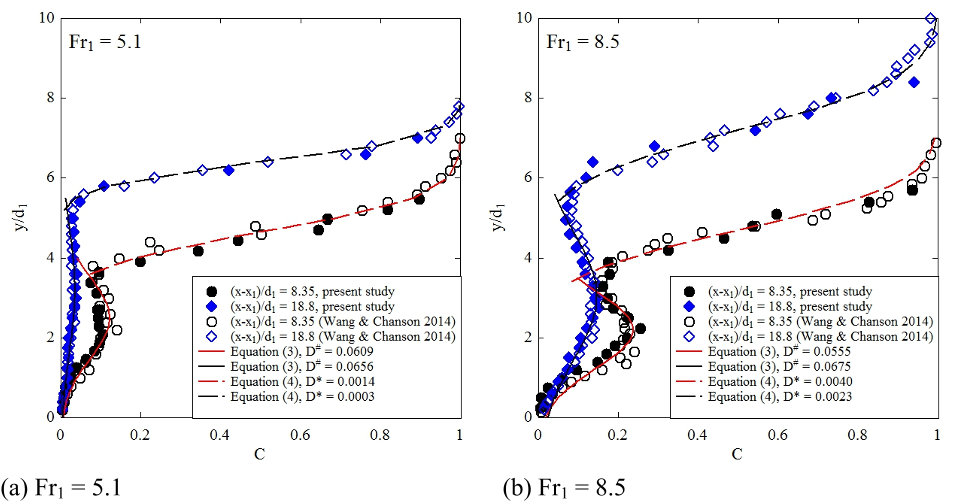 Figure 4. Vertical distributions of time-averaged void fraction at two longitudinal positions in jump roller – Comparison with data of Wang & Chanson (2014) and Equations (3) & (4).
 Figure 5. Vertical distributions of bubble count rate at two longitudinal positions in jump roller – Comparison with bubble count rate and bubble cluster count rate (for C < 0.3) of Wang & Chanson (2014).
 Figure 6. Vertical distributions of time-averaged interfacial velocity, turbulence intensities Tu derived from raw phase-detection probe signal and Tu" from high-frequency signal component – Flow conditions: Q = 0.0347 m3/s, d1 = 0.0206 m, x1 = 0.83 m, Fr1 = 7.5, Re = 6.8×10⁴.
 Figure 7. Vertical distributions of interfacial velocity and longitudinal decay of its maximum.
 Figure 15. Longitudinal variations of dimensionless characteristic frequencies of total pressure fluctuations in the turbulent shear layer; data at y = YFmax. (a, left) Upper pressure fluctuation frequency Fp(H) compared with bubble cluster count rate Fclu (b, right) Lower pressure fluctuation frequency Fp(L) compared with free-surface fluctuation frequency Ffs
 Figure 8. Theoretical total pressure and piezometric pressure distributions.
 Figure 9. Probability density functions of instantaneous total pressure deviation from the mean in the shear layer of hydraulic jumps.
 Figure 1. Prototype and physical modelling of hydraulic jumps.
 Figure 11. Longitudinal decay in maximum mean total pressure and total pressure fluctuation.
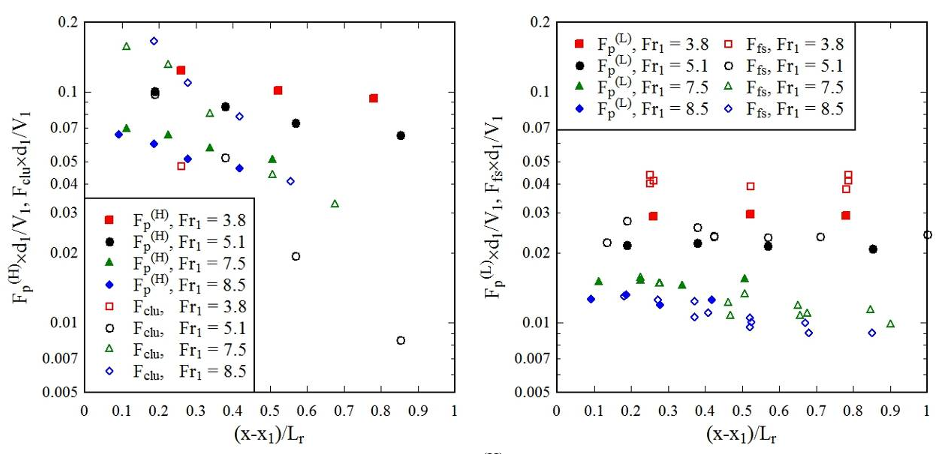 Figure 14. Raw and low-pass filtered total pressure signals recorded in the shear layer – Flow conditions: Q = 0.0347 m3/s, d1 = 0.02 m, x1 = 0.83 m, Fr1 = 7.5, x-x1 = 0.167 m, y = 0.03 m.
 Figure 15. Longitudinal variations of dimensionless characteristic frequencies of total pressure fluctuations in the turbulent shear layer; data at y = YFmax. (a, left) Upper pressure fluctuation frequency Fp(H) compared with bubble cluster count rate Fclu (b, right) Lower pressure fluctuation frequency Fp(L) compared with free-surface fluctuation frequency Ffs
 Figure 3. Inflow conditions.
 Figure 2. Instrumentation setup and photograph of side-by-side dual-tip phase-detection probe and total pressure probe (Right: views in elevation).
 Table 1. Experimental flow conditions and longitudinal locations of measurement cross-sections.
 Table 2. Characteristic total pressure fluctuation frequencies based upon a manual processing of two low-pass filtered signals – Data recorded in the turbulent shear layer at y = YFmax.


