
All figures (14)
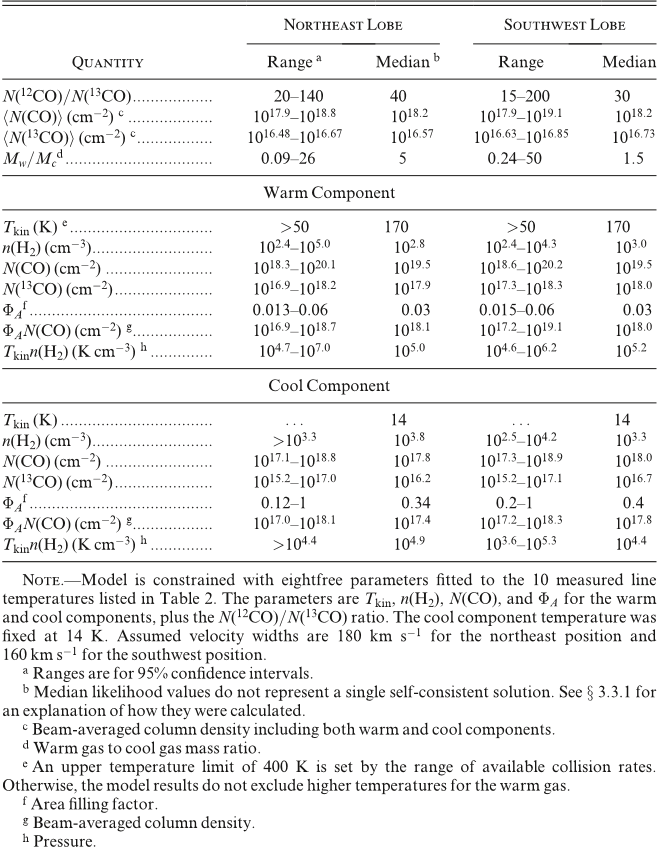 TABLE 3 M82 LVGModel Results
 TABLE 2 Measured M82 Line Strengths
 TABLE 1 COBE Galactic Line Ratios
 TABLE 4 12CO Optical Depths in M82
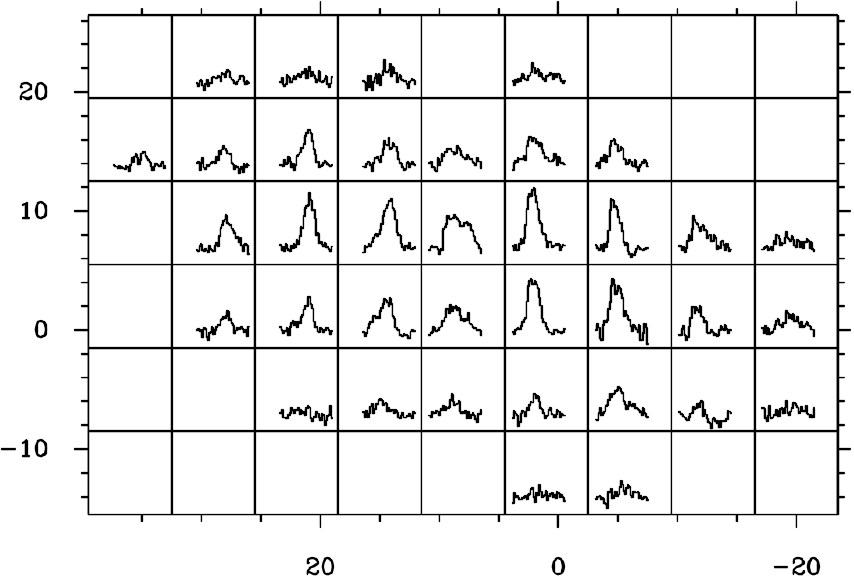 Fig. 1.—Spectra of 12CO J ¼ 6–5 in M82. The map has been rotated such that the horizontal offsets are approximately along the major axis. Offsets are in arcsec from an arbitrary center. The vertical scale ranges fromTMB of 1 to 4.5 K, and the horizontal scale ranges from 80 to 520 km s 1.
 Fig. 8.—Likelihood curves for quantities derived from the LVG model parameters. The solid curves are for the southwest lobe, and the dotted curves the northeast lobe. The total average column density is the sum of the warm and cool component beam-averaged column densities.
 Fig. 10.—Residuals of the 12CO J ¼ 6–5/J ¼ 2–1 line ratio map in K km s 1. The larger errors in the southwest end of the galaxy may be due to a small pointing drift during the observations.
 Fig. 3.—Peak antenna temperature of 12CO J ¼ 6–5 inM82. Contours are forTMB of 1.0, 1.5, 2.0, 2.5, 3.0, 3.5, and 4.0 K.
 Fig. 2.—Integrated intensity of 12CO J ¼ 6–5 inM82. Contours are 50, 100, 150, 200, 250, 300, 350, and 400K km s 1.
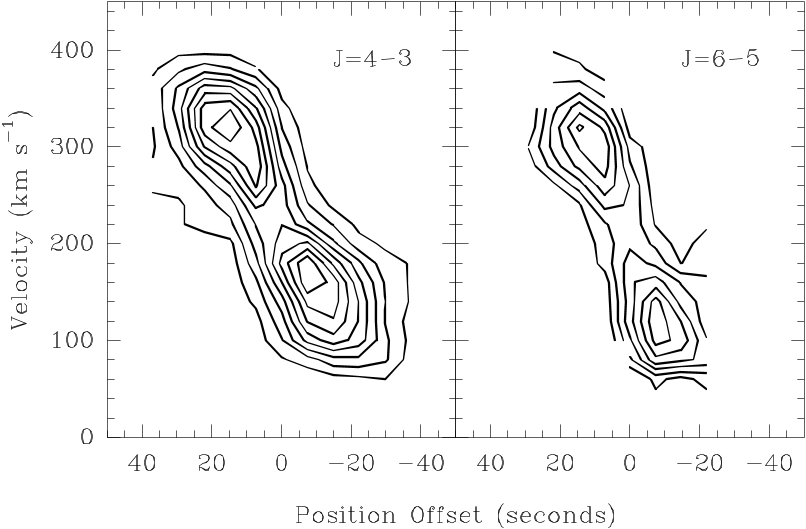 Fig. 4.—Position-velocity diagram along the major axis of M82 for 12CO J ¼ 4–3 and 12CO J ¼ 6–5. The southwest hot spot peaks at different velocities in the two transitions, and the overall velocity gradient is steeper in CO J ¼ 6–5. Note that the broad, lower intensity spectrum between the two hot spots explains the difference in integrated intensity and peak temperature maps. The positions are offset from arbitrary centers along the major axis of the galaxy. Contours are forTMB from 0.5 to 4 K in steps of 0.5 K.
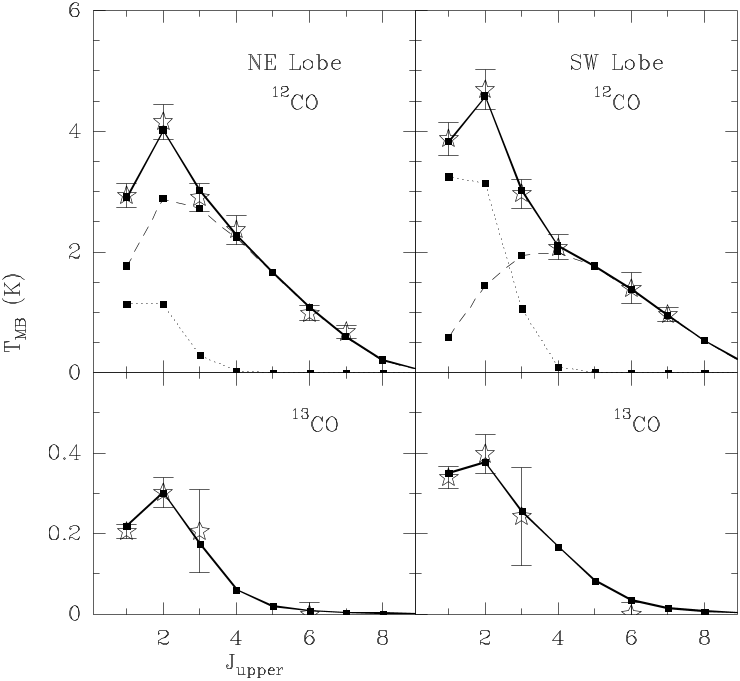 Fig. 9.—Measured temperatures with example LVG solutions for the two main hot spots in M82.Measured values (indicated with stars) and 1 error bars are taken from Table 2, except for 13CO J ¼ 3–2, which was scaled up by 50% as explained in the table notes. The cool and warm components are shown by dotted and dashed lines, respectively, and total temperatures by a solid line. The solution for the northeast lobe is an example solution with low warm component H2 density; in this case, 10 2.6 cm 3. For this solution, the pressures of the two components are both around 105 K cm 3, and the warm component cloud sizes are large, 200 pc. The southwest lobe example, on the other hand, has a warm component H2 density of 103:3 cm 3 and cloud size around 20 pc.
 Fig. 7.—Likelihood curves of the LVG model parameters. The solid curves are for the southwest lobe, and the dotted curves the northeast lobe. The cool component temperature was fixed at 14 K. Note that all parameters are constrained except the cool component density of the northeast lobe and the warm component temperature.
 Fig. 5.—M82 12CO J ¼ 6–5 integrated intensity contours superimposed on 12CO J ¼ 2–1 integrated intensity from Weiss et al. (2001). Contours are 50, 100, 150, 200, 250, 300, 350, and 400K km s 1.
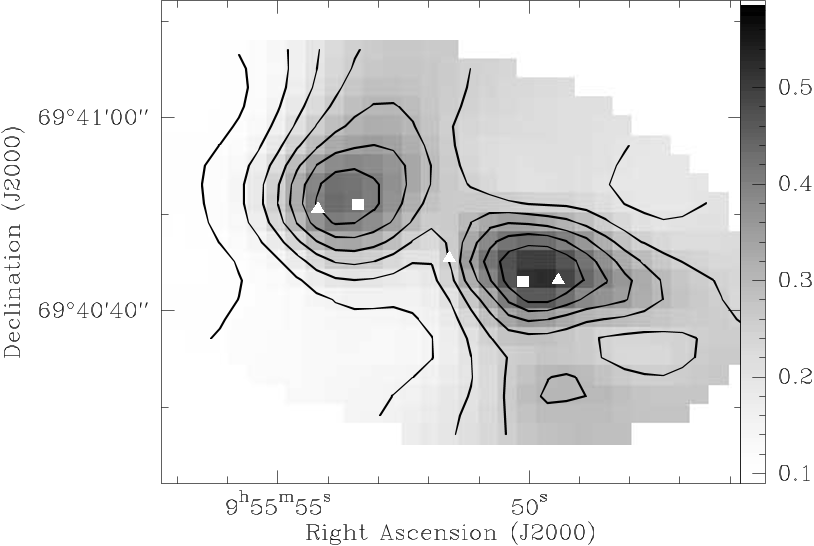 Fig. 6.—Deconvolved 12CO J ¼ 6–5/12CO J ¼ 2–1 brightness temperature ratio map. Contours are from 0.1 to 0.45 by 0.05. The squares indicate the locations of the J ¼ 6–5 intensity peaks, and the triangles the locations of the J ¼ 2–1 integrated intensity peaks.


