
All figures (8)

Table 1. Results for hard energy models. The first column indicates the name of a dataset and number of instances. What follows is a comparison between multiscale and single-scale inference, as well as a comparison to the “Ace” method for each dataset. We report the average energy (value), run-time (time) and the percentage of instances on which the algorithm reported the best energy (best), which sums to more than 100% in case of ties. Enclosed in brackets at the best field is the percentage of instances in which the “Ace” method had provided a certificate of global optimality. 
Figure 3. An instance from the Chinese Character Inpainting dataset. Left panel: ground truth image. Center: masked image Right panel: result of applying LSA-TR within our framework. ![Table 2. Performance on the Chinese Character Inpainting dataset. Five (ten) V-cycles of multiscale inference with LSA-TR reported the best energy on 40% (53%) of the dataset with outstanding runtimes. Energy and run-times are as reported in [12]. The best value can sum to more than 100% in case of ties.](/figures/table-2-performance-on-the-chinese-character-inpainting-1hecmwha.png)
Table 2. Performance on the Chinese Character Inpainting dataset. Five (ten) V-cycles of multiscale inference with LSA-TR reported the best energy on 40% (53%) of the dataset with outstanding runtimes. Energy and run-times are as reported in [12]. The best value can sum to more than 100% in case of ties. 
Figure 4. Two instances from the Scribble dataset. Left panel: user-annotated image. Center: segmentation results of singlescale inference using LSA-TR. Right panel: segmentation attained with 1 V-cycle of our algorithm using LSA-TR. 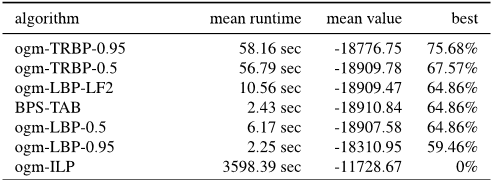
Table 3. Results for the Scribble dataset. We compare single-scale and multiscale inference and report results for a selection of competitive methods that were not incorporated in our framework. On this challenging large-scale dataset, multiscale inference was repeatedly superior to single-scale. QPBO (long) denotes a singlescale, iterative application of QPBO-I; this highlights the advantage of multiscale inference, as even when QPBO-I was run exhaustively it came short compared with multiscale inference. 
Table 4. Results for the pic-obj-det dataset. We compare singlescale and multiscale inference and report results for a selection of competitive methods that were not incorporated in our framework. Multiscale inference reached significantly better energies than single-scale with a slight overhead in run-time. 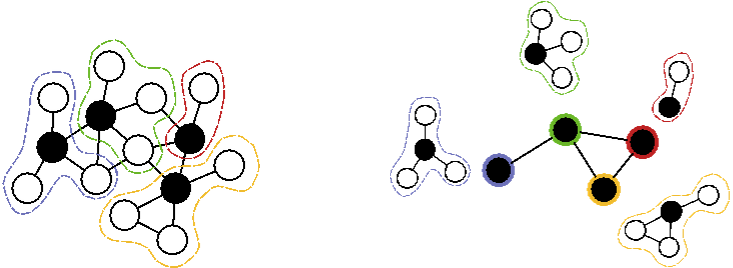
Figure 1. An illustration of variable-grouping, with seed variables denoted by black disks. Note that each seed variable is connected by an edge to each other variable in its group, as required by the interpolation rule. Right panel: the coarse graph, whose vertices correspond to the fine-scale seed vertices, and their coarse unary potentials account for all the internal energy potentials in their group. Edges connect pairs of coarse-vertices according to topology at the fine scale. 
Table 5. Results for multilabel Potts datasets. The first column indicates the name of a dataset and the number of instances. What follows is a comparison between multiscale and single-scale inference of Lazy-Flipper, as well as a comparison to the “Ace” method for each dataset. We report the average energy (value) and run-time (time), the percentage of instances on which an algorithm reported the best energy (best) and provided a certificate of global optimality (enclosed in brackets). Note that nearly all of the instances are solved to optimality, and that different inference methods perform well on different datasets.


![Table 2. Performance on the Chinese Character Inpainting dataset. Five (ten) V-cycles of multiscale inference with LSA-TR reported the best energy on 40% (53%) of the dataset with outstanding runtimes. Energy and run-times are as reported in [12]. The best value can sum to more than 100% in case of ties.](/figures/table-2-performance-on-the-chinese-character-inpainting-1hecmwha.webp)


07 Dec 2015-