
All figures (10)
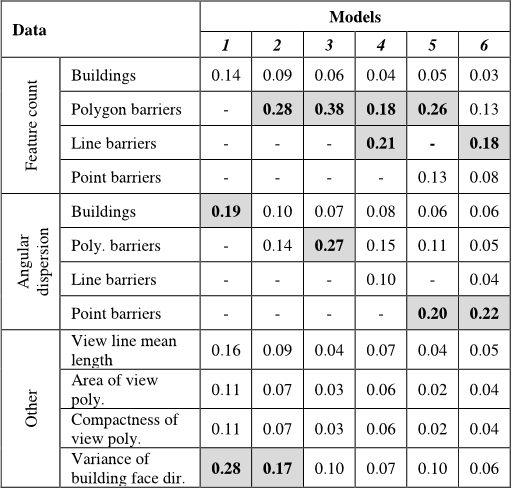
TABLE V. FACTOR IMPORTANCE 
TABLE IV. PREDICTION ACCURACY OF MODELS 
TABLE VI. COMPARISON TO OTHER MODELS 
Figure 4. Modelled 3D error (red) compared to actual mean 3D error (black) for the full experiment path (Model 6) 
TABLE II. OSM TAGS AND FEATURE COUNT IN THE STUDY AREA ![TABLE I. COVERAGE OF OSM TAGS IN JAPAN 2017 [11]](/figures/table-i-coverage-of-osm-tags-in-japan-2017-11-3p63pv94.png)
TABLE I. COVERAGE OF OSM TAGS IN JAPAN 2017 [11] 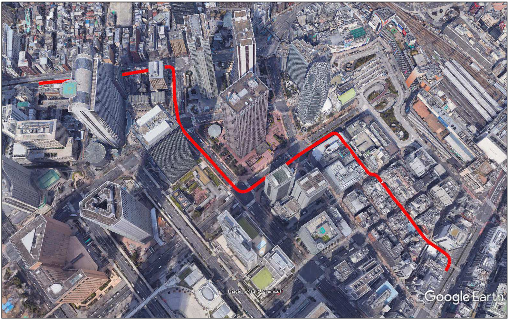
Figure 1. Experiment path in Shinjuku, Tokyo, Japan. 
TABLE III. SUMMARY OF MAPPING DATA USED 
Figure 2. Map showing the ‘completed’ OSM layers and experiment path 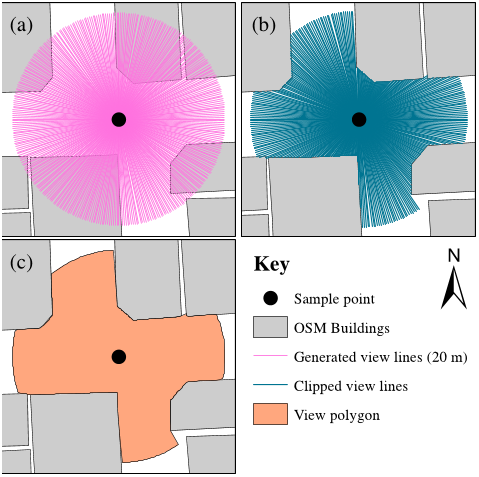
Figure 3. View lines and view polygons.


![TABLE I. COVERAGE OF OSM TAGS IN JAPAN 2017 [11]](/figures/table-i-coverage-of-osm-tags-in-japan-2017-11-3p63pv94.webp)


01 Oct 2019-