
All figures (7)
 Table 3. The Dynamic Response of R 2 to SEOs This table reports the dynamics of R 2 in response to SEOs from the model below:
 Table 1: Descriptive Statistics This table reports the descriptive statistics for U.S. firms during the sample period of 1976-2004, with IPO age of at least 4 years. R 2 , Firm-specific return variation (SSE), and Beta are estimates from equation (B-1), for each firm-year using weekly data. Age is the number of years since the inclusion in CRSP. Leverage is long-term debt over total assets. Profitability is measured by operating return on assets. Market-to-book is the market value of equity plus the book value of debt over total assets. In Panel B, Diversified Firms are those that have multiple segments reported in COMPUSTAT. In Panel C, the control group, Non-SEO firm-years, contains those firm-years that do not fall into any two-year time period before or after an SEO. Significance of the differences between subsamples are based on two-tailed tests (t test for mean and ranksum test for median). ***,** and * indicate significance at the 1%, 5%, and 10% levels respectively.
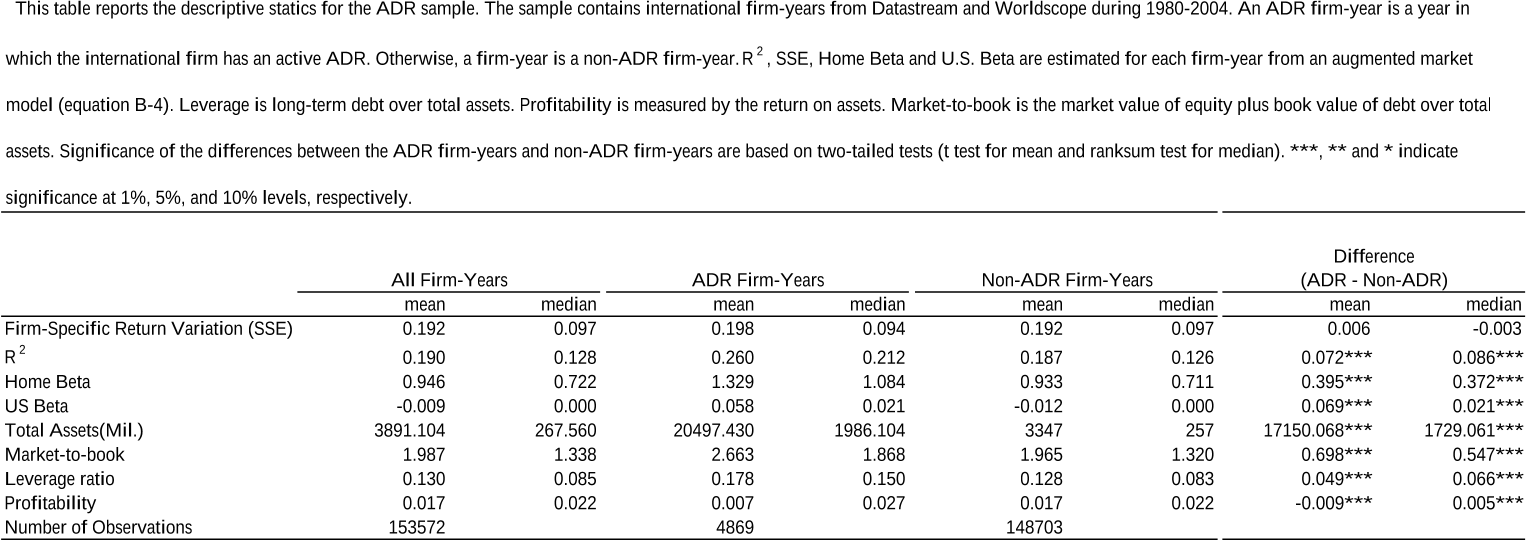 Table 4: Descriptive Statistics of the ADR sample
 Table 1: Descriptive Statistics This table reports the descriptive statistics for U.S. firms during the sample period of 1976-2004, with IPO age of at least 4 years. R 2 , Firm-specific return variation (SSE), and Beta are estimates from equation (B-1), for each firm-year using weekly data. Age is the number of years since the inclusion in CRSP. Leverage is long-term debt over total assets. Profitability is measured by operating return on assets. Market-to-book is the market value of equity plus the book value of debt over total assets. In Panel B, Diversified Firms are those that have multiple segments reported in COMPUSTAT. In Panel C, the control group, Non-SEO firm-years, contains those firm-years that do not fall into any two-year time period before or after an SEO. Significance of the differences between subsamples are based on two-tailed tests (t test for mean and ranksum test for median). ***,** and * indicate significance at the 1%, 5%, and 10% levels respectively.
 Table 2: Age and R 2 This table estimates the effect of firm age on R 2 as follows:
 Table 2: Age and R 2 This table estimates the effect of firm age on R 2 as follows:
 Table 5: The Dynamics of ADR Effects on R 2 This table reports the dynamics of R 2 in response to ADR listings as in the following model:


