All figures (7)

Figure 1: Solomon Islands 
Figure 2: Cooperation vs non cooperation. Trajectories of biomass B(t), community (or group) efforts ek(t), subsistence Hi(t) and cash πi(t) in the case of cooperation (‘c’ in blue) and non cooperation (‘nc’ in black). 
Table 2: Market surveys compilation by community, profit, costs and market price are expresed in $SB, the effort in hour per day per fisher and the catch per kg. 
Table 3: List of parameters and values used in the model. 
Table 1: The number of agent per community and their relative average catchability parameter 
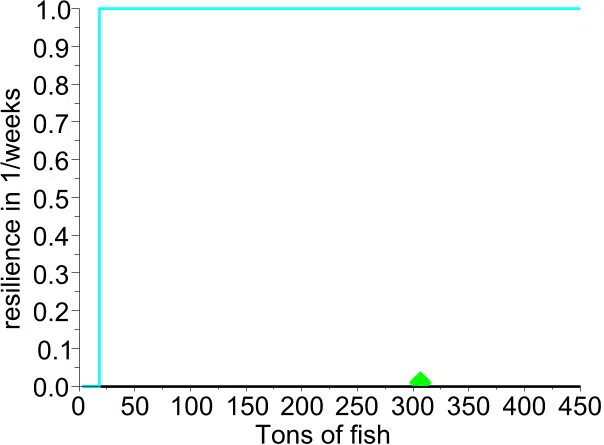
Figure 4: Resilience index: Comparison of resilience index Res(B) under cooperation ‘c’ (blue) and non cooperation ‘nc’ strategies (black). Initial biomass B(t0) as estinmated in 2005 indicated by the green triangle. 
Figure 3: Cooperation vs non cooperation with a 50% shock in the biomass occurring after 3.5 year. Trajectories of biomass B(t), community (or group) efforts ek(t), subsistence Hi(t) and cash πi(t) in the case of cooperation (‘c’ in blue) and non cooperation (‘nc’ in black) .