
All figures (10)

Figure 5. Linearity slope change with stress time. 
Figure 6. Dark rate slope change with stress time. 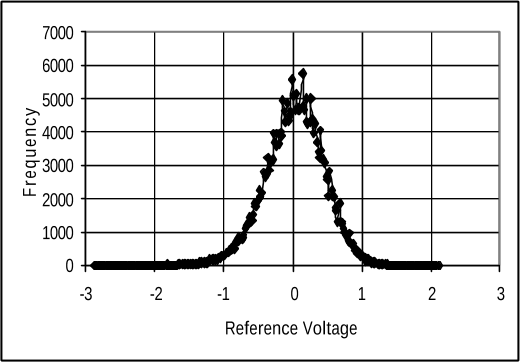
Figure 7. Pixel response during FPN measurement at 27°C. 
Figure 4. Linearity changes with stress time, black symbols indicate time zero, white symbols indicate at the end of stress. 
Figure 2. Schematic of the accelerated testing set-up. 
Figure 3. Stress matrix for the accelerated testing. 
Figure 11. Image with pixel degradation (Median percentage change is 20%). 
Figure 8. Original image of Saturn 
Figure 10. Image with pixel degradation (Median percentage change is 15%). 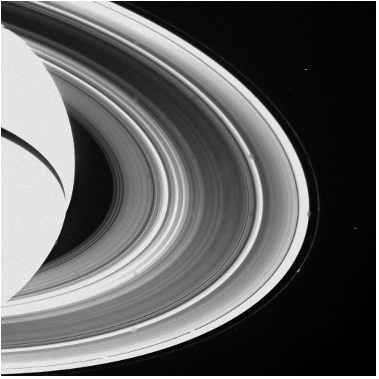
Figure 9. Image with pixel degradation (Median percentage change is 10%).


25 Apr 2004-