
All figures (9)

Figure 6. Time histories of the crest ratio CF= Cmax/Hs, skewness and kurtosis in the period 8–11 November 2007 (Amax is the maximum amplitude equal toCmax). 
Figure 7. Temporal evolution of skewness, kurtosis andAmax/A0 (A0 denotes the initial amplitude used in the simulations while Amax is the maximum amplitude (crest)), 8 November 2007, 18:00 UTC. 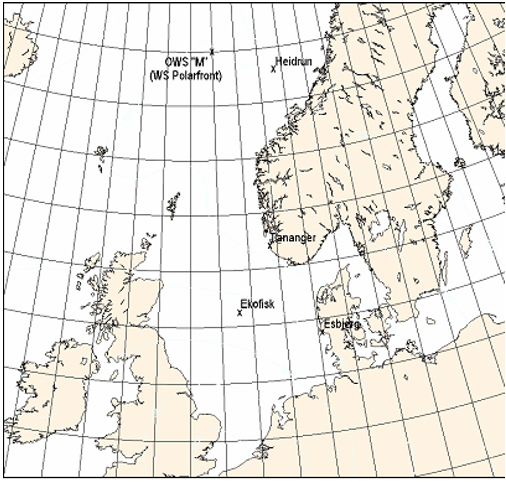
Figure 1. Location of the Ekofisk field. 
Figure 8. Temporal evolution of skewness, kurtosis andAmax/A0 (A0 denotes the initial amplitude used in the simulations while Amax is the maximum amplitude (crest)), 9 November 2007, 00:00 UTC. 
Figure 9. Temporal evolution of skewness, kurtosis andAmax/A0 (A0 denotes the initial amplitude used in the simulations while Amax is the maximum amplitude (crest)), 9 November 2007, 06:00 UTC. 
Figure 2. History of significant wave height, spectral wave period and sea state steepness for the total sea during the Andrea storm. 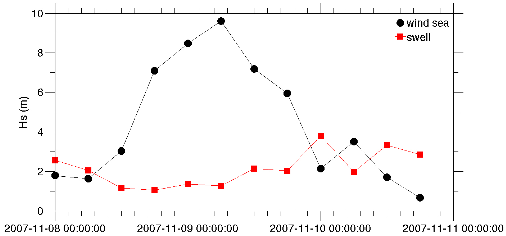
Figure 3. History of significant wave height for wind sea and swell during the Andrea storm. 
Figure 4. Evolution of the directional wave spectrum during the Andrea storm, from 00:00 UTC 8 November 2007 to 06:00 UTC 9 November 2007. 
Figure 5. Evolution of the directional wave spectrum during the Andrea storm, from 12:00 UTC 9 November 2007 to 11 November 2007 18:00 UTC .


01 Sep 2013-