
All figures (12)
 Figure 8. The fraction of galaxies as a function of the minimum external stellar mass contributed by major mergers (μ≥ 1/4, left-hand panel), minor mergers (1/4 > μ ≥ 1/10, middle panel) and accretion (μ < 1/10, right-hand panel) at redshift z = 0 (solid lines), 1 (dashed lines), and 2 ( dotted lines). The galaxies are split into three bins of stellar mass coded by colours. While accretion plays a larger role than mergers in terms of the external stellar mass contribution in low- and intermediate-mass galaxies, at low redshift, major mergers dominate the external mass contribution in the most massive galaxies.
 Figure 9. Major merger fraction as a function of redshift for galaxies with M∗ ≥ 109.5 M (black circles), ≥1010.5 M (blue circles), and M∗ ≥ 1011 M (red circles) derived from Ref-L100N1504. The simulation predictions lie within the scatter of the observational data from both close-pair studies (solid grey symbols) andmorphological diagnostics ( open grey symbols). Curves represent power-law/exponential fits to the simulated merger fraction in the corresponding stellar mass bins.
 Figure 2. An example of a galaxy merger history. The galaxy has a stellar mass M∗ = 1.7× 10¹¹ M at redshift z = 0. Symbol colours and sizes are logarithmically scaled with stellar mass. The thick solid line marks the main branch. The final galaxy is built from many small progenitors, but most of these contributors have very low mass. We also show images of its stellar mass distribution in a 200 comoving kpc box at a few redshifts. The galaxy shows prominent spiral-like structure at redshift z = 1, but then experiences several interactions with other objects, passing through a shell-like phase to transform into an elliptical galaxy at z = 0.
 Figure 6. The initial stellar mass contributions of mergers (i.e. mass ratio μ ≥ 1/10) and diffuse accretion (μ < 1/10) for galaxies of different stellar mass, at redshifts z = 0–3 in three stellar mass bins (as coloured). Solid and dashed lines represent the median of the distribution in Ref-L100N1504 and Recal-L025N0752, respectively. Our analysis stops at the redshift when fewer than 10 galaxies are available. The shaded regions bracket the 25th and the 75th percentiles of the distributions. External mass contributions increase with galaxy stellar mass but decrease with redshift.
 Figure 7. The cumulative distribution of the redshift of the last major merger event (μ ≥ 1/4), zlast, for present-day galaxies (solid lines) and their parent subhaloes (dashed lines). Galaxies are split into three stellar mass bins as labelled. Only 22 per cent of galaxies with M∗ < 1010.5 M have experienced a major merger event at z < 1.5. In contrast, 68 per cent of the most massive galaxies have experienced many recent merger events. This mass dependence is not seen in the zlast distribution of their parent subhaloes, which is due to the non-linear dependence of stellar mass on halo mass. While the distribution for major subhalo mergers is similar to that of low-mass galaxies, the subhalo zlast distribution looks more similar to that of high-mass galaxies when minor halo mergers are included (dotted lines).
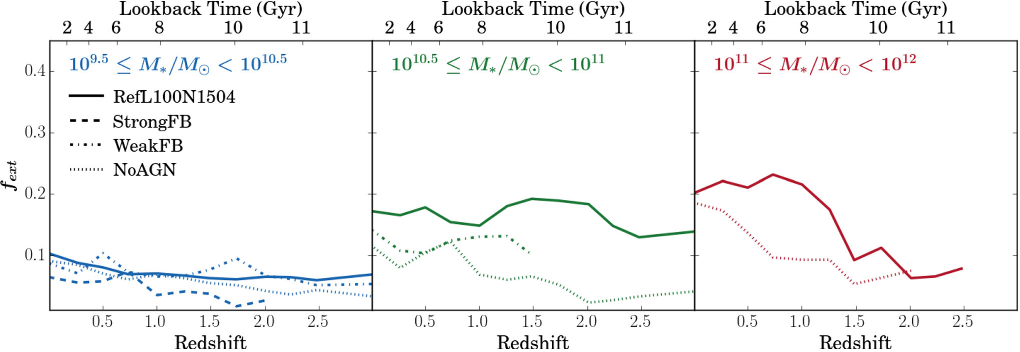 Figure 10. The fractional mass contribution of mergers and accretion for galaxies at redshifts z = 0–3 when there is strong (dashed lines) and weak (dash– dotted) stellar feedback, and no AGN feedback (dotted lines). The reference model (solid lines) is also shown for comparison. We split the galaxies into three stellar mass bins. We only show points for which more than 10 galaxies contribute. Changes in the efficiency of star formation and the role of AGN make significant differences to the external stellar mass fraction.
 Figure 4. Formation and assembly times for the parent dark matter halo of the galaxies shown in Fig 3. Note that haloes are binned by the stellar mass of their central galaxy, but that bins of higher stellar mass correspond to higher mean halo mass. The solid line represents the case where tf = ta, as in Fig 3. In contrast to the situation for galaxies, tf and ta increase with decreasing stellar mass, demonstrating the hierarchical nature of the mass assembly of dark matter haloes. Note, however, that formation and assembly times are similar regardless of mass, meaning that halo growth is dominated by accretion of diffuse material. The assembly histories of haloes are markedly different from those of the galaxies they contain.
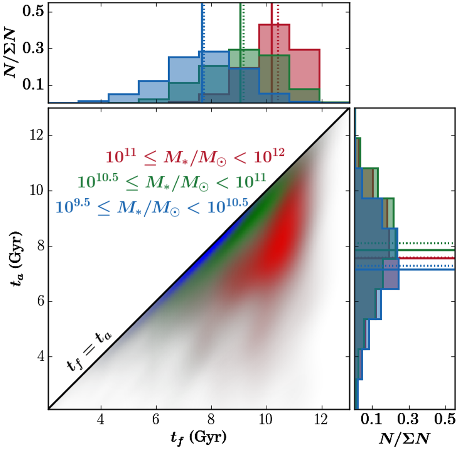 Figure 3. The formation time, tf, as a function of assembly time, ta, for galaxies at z = 0. Both time-scales are measured as lookback times in Gyr, and the galaxies are classified into three bins of stellar mass by colours. The solid line represents the one to one relation for the two time-scales. Galaxies with stellar mass (M∗ ≤ 1010.5 M ), are distributed along this line, indicating that they assemble most of their stars through in situ star formation. Inmassive galaxies ofM∗ > 1011 M , by contrast, ta lags behind tf, and the galaxies are offset from the ta = tf line, showing the importance of stars formed in other objects and subsequently accreted. The normalized histograms of the tf and ta distributions are shown in marginal panels. The mean and the median of the distributions are indicated by the solid and dotted lines, respectively.
 Table 1. The values of the parameters a, b, c, with 1σ uncertainties, of a power-law/exponential fitting function a(1 + z)bec(1 + z) in which z is redshift. These values are determined by the least-square fittings to the predicted galaxy merger fraction in three stellar mass bins.
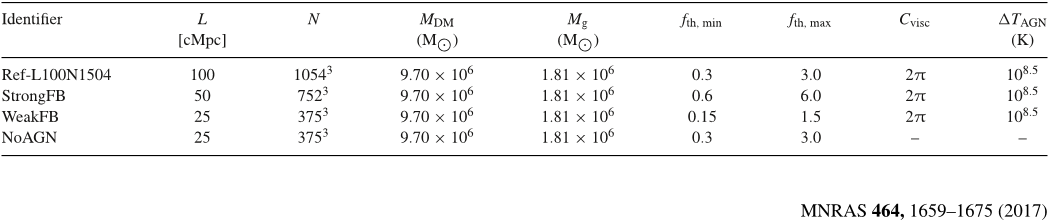 Table 2. Values of the parameters used in the simulations with varying feedback efficiency: size of the simulation volume (L), particle number (N), dark matter and initial baryonic particle mass (MDM and Mg), the asymptotic minimum and maximum value of stellar feedback efficiency (fth, min and fth, max), accretion disc viscosity Cvisc, and the temperature increment of stochastic AGN heating ( TAGN). We refer readers to Crain et al. (2015) for detailed information on these paramertes.
 Figure 5. The evolution of the relative difference between the assembly and formation times, δt, for galaxies in three stellar mass bins (indicated by colour and legend). Lines represent the medians of the δt distributions. The shaded regions enclose the 25th–75th percentiles. Bins with fewer than 10 galaxies are not shown. δt increases with stellar mass but decreases with redshift, showing the importance of external processes in the mass assembly of low-redshift massive galaxies. These trends are insensitive to resolution, as shown by the agreement between the results of Ref-L100N1504 (solid lines) and of Recal-L025N0752 (dashed lines), although the latter simulation lacks objects in the highest mass bin.
 Figure 1. A section of a subhalo merger tree illustrating how subhaloes following branches A and B exchange particles before merging. The colour of the solid symbol reflects the halo mass, while the size of the circle represents the ‘branch mass’, which is the sum of the total mass of all the progenitors sitting on the same branch. A see-saw behaviour is clearly seen in the evolution of the halo mass, which may confuse identification of the most important branch. Instead, we use branch mass to locate the main branch of the tree. In this plot, branch A has the largest branch mass and is therefore chosen as the main branch, even though its progenitors are not always the most massive ones.
Yan Qu1, John C. Helly2, Richard G. Bower2, Tom Theuns2, Robert A. Crain3, Carlos S. Frenk2, Michelle Furlong2, Stuart McAlpine2, Matthieu Schaller2, Joop Schaye4, Simon D. M. White5 • 


