All figures (7)
 FIGURE 1: Partial amino acid sequence of the pPIC9K/tPA secretion signal fused to the mature N-terminal of tPA is shown, as well as the expected two endoproteolytic split sites (KEX2, STE13).
![FIGURE 8: Dependence of the activity of human tPA (Va) on [Pg]. (1) The reaction was performed with 3.3× 10⁻⁴ µM tPA in the absence of fibrinogen fragments. The solid curveVa ) 0.0005Pg/ (4.5 + Pg) represents the best fit; see model 2. The dashed lineVa ) 0.0001Pg is shown as an example of an alternative fit. (2) The reaction was performed under the same conditions but in the presence of fibrinogen fragments. The solid curveVa ) 0.0085Pg/ (0.1 + Pg) represents the best fit; see model 3.](/figures/figure-8-dependence-of-the-activity-of-human-tpa-va-on-pg-1-25rq2pyu.png) FIGURE 8: Dependence of the activity of human tPA (Va) on [Pg]. (1) The reaction was performed with 3.3× 10⁻⁴ µM tPA in the absence of fibrinogen fragments. The solid curveVa ) 0.0005Pg/ (4.5 + Pg) represents the best fit; see model 2. The dashed lineVa ) 0.0001Pg is shown as an example of an alternative fit. (2) The reaction was performed under the same conditions but in the presence of fibrinogen fragments. The solid curveVa ) 0.0085Pg/ (0.1 + Pg) represents the best fit; see model 3.
FIGURE 8: Dependence of the activity of human tPA (Va) on [Pg]. (1) The reaction was performed with 3.3× 10⁻⁴ µM tPA in the absence of fibrinogen fragments. The solid curveVa ) 0.0005Pg/ (4.5 + Pg) represents the best fit; see model 2. The dashed lineVa ) 0.0001Pg is shown as an example of an alternative fit. (2) The reaction was performed under the same conditions but in the presence of fibrinogen fragments. The solid curveVa ) 0.0085Pg/ (0.1 + Pg) represents the best fit; see model 3.![FIGURE 7: Dependence of the prestationary phase rate coefficient (k*) on [Pg] obtained for bovine tPA without fibrinogen fragments. The chart was approximated according to the appropriate formula in eq 4. The solid curve represents the best fitk* ) 0.3Pg/(1+ Pg/0.1)+ 0.006 which corresponds to the ratiok-/k+ ) 50; see model 2. The dashed curvek* ) 0.3Pg/(1+ Pg/0.1)+ 0.0003 is shown as an example of alternative fit which corresponds to the ratio k-/k+ ) 1000; see model 2.](/figures/figure-7-dependence-of-the-prestationary-phase-rate-2ryw3qdp.png) FIGURE 7: Dependence of the prestationary phase rate coefficient (k*) on [Pg] obtained for bovine tPA without fibrinogen fragments. The chart was approximated according to the appropriate formula in eq 4. The solid curve represents the best fitk* ) 0.3Pg/(1+ Pg/0.1)+ 0.006 which corresponds to the ratiok-/k+ ) 50; see model 2. The dashed curvek* ) 0.3Pg/(1+ Pg/0.1)+ 0.0003 is shown as an example of alternative fit which corresponds to the ratio k-/k+ ) 1000; see model 2.
FIGURE 7: Dependence of the prestationary phase rate coefficient (k*) on [Pg] obtained for bovine tPA without fibrinogen fragments. The chart was approximated according to the appropriate formula in eq 4. The solid curve represents the best fitk* ) 0.3Pg/(1+ Pg/0.1)+ 0.006 which corresponds to the ratiok-/k+ ) 50; see model 2. The dashed curvek* ) 0.3Pg/(1+ Pg/0.1)+ 0.0003 is shown as an example of alternative fit which corresponds to the ratio k-/k+ ) 1000; see model 2. FIGURE 9: Two interconvertible forms of bovine tPA with high and low affinity for Pg. The form tPA* possessing low affinity for Pg exists in equilibrium (50:1) with the high affinity form, tPA. It could be speculated that tPA* only is restricted in its ability to bind Pg (binding interactions symbolized by the B site) while remaining catalytically active (active site symbolized by A).
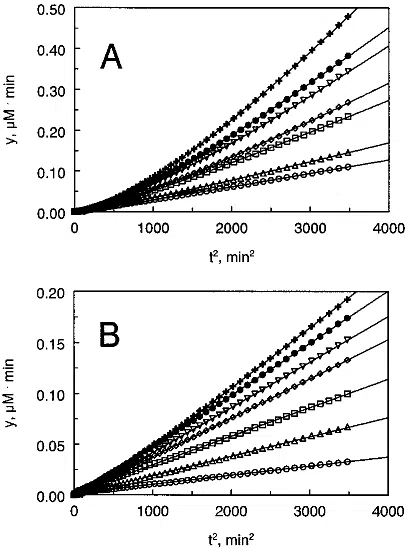
 FIGURE 4: Release ofp-nitroaniline after cleavage of the chromogenic plasmin substrate S-2251 in the reaction medium with tPA and Pg presented in the transformed coordinatesy versust2 (see eqs 3 and 6). Solid lines show the best fit according to eq 6 and model 2. (A) The dependence was obtained for bovine tPA. The symbols O, 4, 0, ), 3, b, and + correspond to the Pg concentrations 0.084, 0.19, 0.30, 0.41, 0.52, 0.63, and 0.84µM, respectively. (B) The dependence was obtained for human tPA. The symbolsO, 4, 0, ), 3, b, and + correspond to the Pg concentrations 0.084, 0.19, 0.30, 0.41, 0.52, 0.63, and 0.73µM, respectively.
 FIGURE 3: Inhibition of the bovine tPA-mediated plasminogen activation by PAI-1, PAI-2, and EACA in the presence of fibrinogen fragments. In the case of inhibition by PAI-1 and PAI-2, 2 pmol of tPA was incubated at room temperature for 20 min with 9 pmol PAI-1or PAI-2 before addition to the reaction mixture consisting of 0.1 M Tris pH 7.4, 0.02% Tween 80, 0.27µM Plg, 8.4 µg fibrinogen fragments, and 0.5 mM S-2251 in a total volume of 0.2 mL. EACA was added to the reaction mixture just before initiation of the reaction. The reaction velocity was calculated as the slope of the line in a plot of the absorbance versust2.
 FIGURE 2: (A) Zymography (lane 1) and SDS-PAGE (lane 2) of one-chain tPA. (B) SDS-PAGE of one- and two-chain tPA. Lanes: (1) one-chain tPA unreduced, (2) two-chain tPA unreduced, (3) one-chain tPA reduced, (4) two-chain tPA reduced.

![FIGURE 8: Dependence of the activity of human tPA (Va) on [Pg]. (1) The reaction was performed with 3.3× 10⁻⁴ µM tPA in the absence of fibrinogen fragments. The solid curveVa ) 0.0005Pg/ (4.5 + Pg) represents the best fit; see model 2. The dashed lineVa ) 0.0001Pg is shown as an example of an alternative fit. (2) The reaction was performed under the same conditions but in the presence of fibrinogen fragments. The solid curveVa ) 0.0085Pg/ (0.1 + Pg) represents the best fit; see model 3.](/figures/figure-8-dependence-of-the-activity-of-human-tpa-va-on-pg-1-25rq2pyu.webp)
![FIGURE 7: Dependence of the prestationary phase rate coefficient (k*) on [Pg] obtained for bovine tPA without fibrinogen fragments. The chart was approximated according to the appropriate formula in eq 4. The solid curve represents the best fitk* ) 0.3Pg/(1+ Pg/0.1)+ 0.006 which corresponds to the ratiok-/k+ ) 50; see model 2. The dashed curvek* ) 0.3Pg/(1+ Pg/0.1)+ 0.0003 is shown as an example of alternative fit which corresponds to the ratio k-/k+ ) 1000; see model 2.](/figures/figure-7-dependence-of-the-prestationary-phase-rate-2ryw3qdp.webp)