scispace - formally typeset
Open AccessJournal ArticleDOI

Bias correction of daily precipitation simulated by a regional climate model: a comparison of methods

Thomas Lafon, +3 more
- 01 May 2013 - 
- Vol. 33, Iss: 6, pp 1367-1381
Reads0
Chats0
TLDR
The authors compared the performance of four published techniques used to reduce the bias in a regional climate model precipitation output: (1) linear, (2) nonlinear, (3) γ-based quantile mapping and (4) empirical quantile mappings.
Abstract
Quantifying the effects of future changes in the frequency of precipitation extremes is a key challenge in assessing the vulnerability of hydrological systems to climate change but is difficult as climate models do not always accurately simulate daily precipitation. This article compares the performance of four published techniques used to reduce the bias in a regional climate model precipitation output: (1) linear, (2) nonlinear, (3) γ -based quantile mapping and (4) empirical quantile mapping. Overall performance and sensitivity to the choice of calibration period were tested by calculating the errors in the first four statistical moments of generated daily precipitation time series and using a cross-validation technique. The study compared the 1961–2005 precipitation time series from the regional climate model HadRM3.0-PPE-UK (unperturbed version) with gridded daily precipitation time series derived from rain gauges for seven catchments spread throughout Great Britain. We found that while the first and second moments of the precipitation frequency distribution can be corrected robustly, correction of the third and fourth moments of the distribution is much more sensitive to the choice of bias correction procedure and to the selection of a particular calibration period. Overall, our results demonstrate that, if both precipitation data sets can be approximated by a γ -distribution, the γ -based quantilemapping technique offers the best combination of accuracy and robustness. In circumstances where precipitation data sets cannot adequately be approximated using a γ -distribution, the nonlinear method is more effective at reducing the bias, but the linear method is least sensitive to the choice of calibration period. The empirical quantile mapping method can be highly accurate, but results were very sensitive to the choice of calibration time period. However, it should be borne in mind that bias correction introduces additional uncertainties, which are greater for higher order moments.

read more

Content maybe subject to copyright    Report

Copyright © 2012 Royal Meteorological Society
This version available http://nora.nerc.ac.uk/19367/
NERC has developed NORA to enable users to access research outputs
wholly or partially funded by NERC. Copyright and other rights for material
on this site are retained by the rights owners. Users should read the terms
and conditions of use of this material at
http://nora.nerc.ac.uk/policies.html#access
This document is the author’s final manuscript version of the journal
article, incorporating any revisions agreed during the peer review
process. Some differences between this and the publisher’s version
remain. You are advised to consult the publisher’s version if you wish
to cite from this article.
The definitive version is available at http://onlinelibrary.wiley.com
Article (refereed) - postprint
Lafon, Thomas; Dadson, Simon; Buys, Gwen; Prudhomme, Christel. 2013.
Bias correction of daily precipitation simulated by a regional climate
model: a comparison of methods. International Journal of Climatology, 33
(6). 1367-1381. 10.1002/joc.3518
Contact CEH NORA team at
noraceh@ceh.ac.uk
The NERC and CEH trademarks and logos (‘the Trademarks’) are registered trademarks of NERC in the UK and
other countries, and may not be used without the prior written consent of the Trademark owner.

1
Bias correction of daily precipitation simulated by a Regional Climate Model: A
comparison of methods
Thomas Lafon
1,2,3
, Simon Dadson
1
, Gwen Buys
1,4
, and Christel Prudhomme
1
[1] Centre for Ecology and Hydrology, Maclean Building, Crowmarsh Gifford,
Wallingford, OX10 8BB. UK
[2] Now at Oxford Brookes University, Headington Campus, Gipsy Lane,
Oxford OX3 0BP, UK
[3] Fundación Entropika, Apartado Aéreo N˚ 20,
Leticia, Amazonas, Colombia
[4] Now at British Antarctic Survey, High Cross, Madingley Road,
Cambridge, CB3 0ET, UK
Corresponding author: tlafon@entropika.org
Thomas Lafon

2
Abstract
Quantifying the effects of future changes in the frequency of precipitation extremes is a key
challenge in assessing the vulnerability of hydrological systems to climate change, but is difficult as
climate models do not always accurately simulate daily precipitation. This paper compares the
performance of four published techniques used to reduce the bias in a Regional Climate Model
(RCM) precipitation output: (i) linear, (ii) non-linear, (iii) gamma-based quantile mapping and (iv)
empirical quantile mapping. Overall performance and sensitivity to the choice of calibration period
were tested by calculating the errors in the first four statistical moments of generated daily
precipitation time series and using a cross validation technique. The study compared the 1961-2005
precipitation time series from the Regional Climate Model HadRM3.0-PPE-UK (unperturbed
version) with gridded daily precipitation time series derived from rain gauges for seven catchments
spread throughout Great Britain. We found that whilst the first and second moments of the
precipitation frequency distribution can be corrected robustly, correction of the third and fourth
moments of the distribution is much more sensitive to the choice of bias-correction procedure and
to the selection of a particular calibration period. Overall, our results demonstrate that, if both
precipitation datasets can be approximated by a gamma distribution, the gamma-based quantile-
mapping technique offers the best combination of accuracy and robustness. In circumstances where
precipitation datasets cannot adequately be approximated using a gamma distribution, the non-linear
method is more effective at reducing the bias but the linear method is least sensitive to the choice of
calibration period. The empirical quantile mapping method can be highly accurate, but results were
very sensitive to the choice of calibration time period. However, it should be borne in mind that bias
correction introduces additional uncertainties, which are greater for higher-order moments.

3
Key words: Regional climate model, bias correction, daily precipitation, downscaling, cross-
validation, UK.
Sponsors: Natural Environment Research Council (UK); Environment Agency (UK); DEFRA
(UK), UK Water Industry Research (UKWIR).

4
1. Introduction
The impact of climate change on the hydrological cycle is of great interest to environmental and
water resource managers (Arnell, 2001, Bates et al., 2008). Quantifying the effects of future
changes in the frequency of daily precipitation extremes is a key challenge in assessing the
vulnerability of hydrological systems to climate change. Nevertheless, whilst the accuracy of Global
Climate Models (GCMs) in simulating the large-scale atmospheric circulation has improved
markedly in recent years, global models have difficulty resolving the processes that govern local
precipitation. The most common problem associated with GCM simulations of precipitation is that,
at a daily time-scale, precipitation occurs more frequently than observed, but often with a lower
intensity (e.g., Sun et al., 2006).
In order to make simulations at hydrologically-relevant spatial and temporal scales, downscaling is
necessary. Downscaling techniques that have been reviewed in the literature include statistical
downscaling, which uses empirical relations between climate model outputs and historical observed
data, and dynamical downscaling, which involves the use of a Regional Climate Model (RCM) (see
Fowler et al., 2007 for a detailed review). RCMs offer a more physically-realistic approach to GCM
downscaling than statistical downscaling because they provide an explicit representation of the
mesoscale atmospheric processes that produce heavy precipitation. When nested within a GCM,
RCMs provide regional detail that is not only consistent with the parent GCM, but which is
spatially-coherent. That is, a degree of spatial persistence of large-scale atmospheric features is
automatically ensured, because the model generates these features dynamically. This property of
RCM simulations is important in producing realistic forcing data for hydrological models because
many floods and droughts are caused by spatially- and temporally-persistent precipitation patterns.
Two major studies of the accuracy of RCM precipitation estimates used daily extreme precipitation
statistics to compare the performance of several different 50 km RCMs nested within both ECMWF
ERA-15 reanalysis data (Frei et al., 2003), and within the Hadley Centre HadAM3 GCM (Frei et
al., 2006). They found that the RCMs were capable of reproducing important mesoscale patterns of

Figures
Citations
More filters
Journal ArticleDOI

Climatologies at high resolution for the earth’s land surface areas

TL;DR: In this article, the authors presented the CHELSA (Climatologies at high resolution for the earth's land surface areas) data of downscaled model output temperature and precipitation estimates of the ERA-Interim climatic reanalysis to a high resolution of 30'arc'sec.
Journal ArticleDOI

Climatologies at high resolution for the earth's land surface areas

TL;DR: It is shown that CHELSA climatological data has a similar accuracy as other products for temperature, but that its predictions of precipitation patterns are better and can increase the accuracy of species range predictions.
Journal ArticleDOI

Finding appropriate bias correction methods in downscaling precipitation for hydrologic impact studies over North America

TL;DR: In this paper, the authors compared the performance of six bias correction methods for hydrological modeling over 10 North American river basins and found that bias correction performance is location dependent and that a careful validation should always be performed, especially on studies over new regions.
Journal ArticleDOI

Performance and uncertainty evaluation of empirical downscaling methods in quantifying the climate change impacts on hydrology over two North American river basins

TL;DR: In this article, the uncertainty of six empirical downscaling methods in quantifying the hydrological impact of climate change over two North American river basins under different climate conditions was assessed.
References
More filters
Journal ArticleDOI

A daily weather generator for use in climate change studies

TL;DR: The development of a weather generator for use in climate impact assessments of agricultural and water system management, which produces internally consistent series of meteorological variables including: rainfall, temperature, humidity, wind, sunshine, as well as derivation of potential evapotranspiration.
Journal ArticleDOI

Daily precipitation statistics in regional climate models: Evaluation and intercomparison for the European Alps

TL;DR: In this article, a 15-year evaluation of the statistics of daily precipitation as simulated by five regional climate models using comprehensive observations in the region of the European Alps is performed. But the results show that the model errors are very similar between the two models with the same dynamical core (but different parameterizations).
Journal ArticleDOI

How Often Does It Rain

TL;DR: In this paper, daily precipitation data from worldwide stations and gridded analyses and from 18 coupled global climate models are used to evaluate the models' performance in simulating the precipitation frequency, intensity, and the number of rainy days contributing to most (i.e., 67%) of the annual precipitation total.
Journal ArticleDOI

Resampling of regional climate model output for the simulation of extreme river flows

TL;DR: In this paper, the authors investigated whether resampling of the output from a regional climate model (RCM) can provide realistic long-duration sequences of precipitation and temperature for the simulation of extreme river flows.

UK Climate Projections Briefing Report

TL;DR: The 2009 UK Climate Projections (UKCP09) as discussed by the authors provide a basis for studies of impacts and vulnerability and decisions on adaptation to climate change in the UK over the 21st century.
Related Papers (5)
Frequently Asked Questions (17)
Q1. What contributions have the authors mentioned in the paper "Bias correction of daily precipitation simulated by a regional climate model: a comparison of methods" ?

Fernando et al. this paper used a Regional Climate Model ( RCM ) to calculate the difference between future and baseline climate from the GCM/RCM outputs and apply this factor of change to historical observed time series to generate synthetic time series assumed to be possible realisations of the future. 

Quantifying the effects of future changes in the frequency of daily precipitation extremes is a key challenge in assessing the vulnerability of hydrological systems to climate change. 

Downscaling techniques that have been reviewed in the literature include statistical downscaling, which uses empirical relations between climate model outputs and historical observed data, and dynamical downscaling, which involves the use of a Regional Climate Model (RCM) (see Fowler et al., 2007 for a detailed review). 

When correcting for biases in climate model output, it is also important that changes in the frequency distribution of climatic variables are correctly represented. 

The most comprehensive correction was achieved by using the empirical quantile-mapping methods, which incorporate information from the frequency distributions of modelled and observed precipitation. 

RCMs offer a more physically-realistic approach to GCM downscaling than statistical downscaling because they provide an explicit representation of the mesoscale atmospheric processes that produce heavy precipitation. 

This property of RCM simulations is important in producing realistic forcing data for hydrological models because many floods and droughts are caused by spatially- and temporally-persistent precipitation patterns. 

This suggests that, while the greatest accuracy is achieved by an empirical distribution method defined by at least 25 quantiles (i.e., the overall error from the same calibration-evaluation period is smallest), results are also most sensitive to the chosen calibration period. 

At the same time, the potential to over-calibrate the bias-correction procedure to aparticular set of reference data increases as more and more observed data are used to calculate the correction parameters. 

Techniques to correct the biases in the climate model outputs are therefore used to improve the realism of GCM/RCM precipitation time series, based on statistical properties obtained from observed data taken from the same baseline period. 

For the skewness and kurtosis, the highest frequency of error reduction is achieved by the linear method (61% and 62%, respectively), while the lowest frequency is obtained using the empirical distribution method with 50 quantiles (24% and 18%, respectively). 

the effectiveness of bias-correction was found to be sensitive to the time-period for which the bias-correction procedures have been calibrated. 

For the higher moments, the frequency of error reduction further decreases to 11% (gamma distribution and linear methods) and 6% (empirical distribution method with 25 quantiles) for skewness, and to 11% (linear method and empirical distribution method with 75 and 100 quantiles) methods to 7% (non-linear method) for kurtosis. 

the correction method based on a gamma distribution offers the best combination of accuracy and robustness, but it is valid only when the observed and modelled precipitation data are gamma distributed. 

Another approach is to generate synthetic precipitation time series using a stochastic weather generator, where the parameters in the generator are changed according to estimated changes in the climate from the GCM/RCM outputs (e.g. Kilsby et al., 2007, Fatichi et al., 2011). 

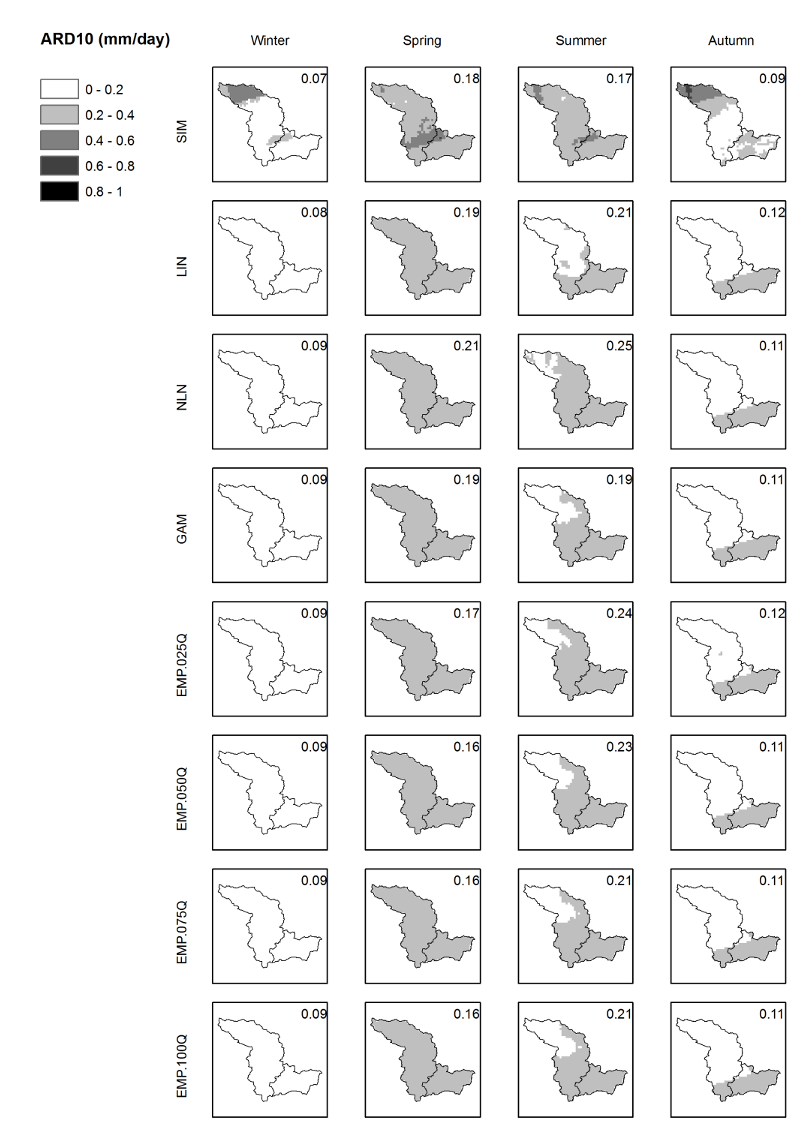
To evaluate the robustness of the correction procedure, the authors calculated the average of the absolute value of the relative differences (ARD, defined as | | ⁄ , where X and X’ are statistics from observed and bias-corrected precipitation, respectively) between the N-m+1 sets of corrected and observed precipitation data over the m-year period that was not used to calibrate the bias-correction method. 

The robustness of the methods for the six remaining catchments is assessed by considering how the performance of each correction method varies with location and climatic characteristics using the methodology described above.