scispace - formally typeset
Open AccessPosted ContentDOI

A Comprehensive Evaluation of Surface Air Temperature Reanalyses over China against Urbanization Bias–Adjusted Observations

TLDR
In this article, the authors compare the differences in surface air temperature (SAT) between observational that has been adjusted for urbanization bias and reanalysis data (NCEPV1, N CEPV2, ERA5, CFSR, MERRA, JRA55, 20CRV3 and CRA40) over mainland China during 1961-2015.
About
This article is published in Advances in Climate Change Research.The article was published on 2021-02-12 and is currently open access. It has received 13 citations till now.

read more

Citations
More filters

Estimation of urbanization bias in observed surface temperature change in China from 1980 to 2009 using satellite land-use data

Wang, +3 more
TL;DR: In this article, the urbanization effect on observed temperatures from 1980 to 2009 in China is estimated, based on analysis of urban land use from satellite observation, and the urban heat island (UHI) effect can be estimated if the urban effect on C3 is negligible.
Journal Article

The study on heat island effect in Beijing during last 40 years

TL;DR: The results show that the difference of mean daily temperature between city and suburb is the largest on 24 December in 1995 during the last 4 0 years, and an obvious 12 years cycle of mean annual temperature is found.
Journal ArticleDOI

Changes in the global mean air temperature over land since 1980

TL;DR: In this article , changes in frequency of record-breaking land surface temperature over Earth's since 1980 are assessed using six different gridded datasets comprising monthly mean air temperature and weather station data retrieved from Global Historical Climatology Network and NOAA Global Summary of the Day.

Evaluation of Atmospheric Precipitable Water from Reanalysis Products Using Homogenized Radiosonde Observations over China

TL;DR: In this paper, the authors evaluated the reliability and consistencies of multidecadal atmospheric reanalysis products and found that most of the reanalyses reproduce well the observed long-term atmospheric precipitable water (PW) changes and interannual variations over China.
Journal ArticleDOI

Accuracy Evaluation and Analysis of GNSS Tropospheric Delay Inversion from Meteorological Reanalysis Data

TL;DR: In this paper , the authors evaluate the consistency and accuracy of three different types of reanalysis data (i.e., ERA5, MERRA2, and CRA40) used to invert the zenith tropospheric delay (ZTD) from 436 international GNSS service (IGS) stations in 2020, based on the integral method.
References
More filters

Evaluation of Atmospheric Circulation in the Southern Hemisphere in 20CRv2

Fan, +3 more
TL;DR: HadSLPv2 as mentioned in this paper ) is a 20CRv2 version of the HadSLP-1 version of HadSlP v2, which was released in 2010.
Related Papers (5)

An Evaluation of the Performance of the Twentieth Century Reanalysis Version 3

Laura C. Slivinski, +47 more
- 01 Feb 2021 - 
Frequently Asked Questions (7)
Q1. How many reanalysis datasets have been developed?

The biases in 70 inter–annual variability, time series, and spatial distribution characteristics between reanalysis and 71 observational data have been analyzed. 

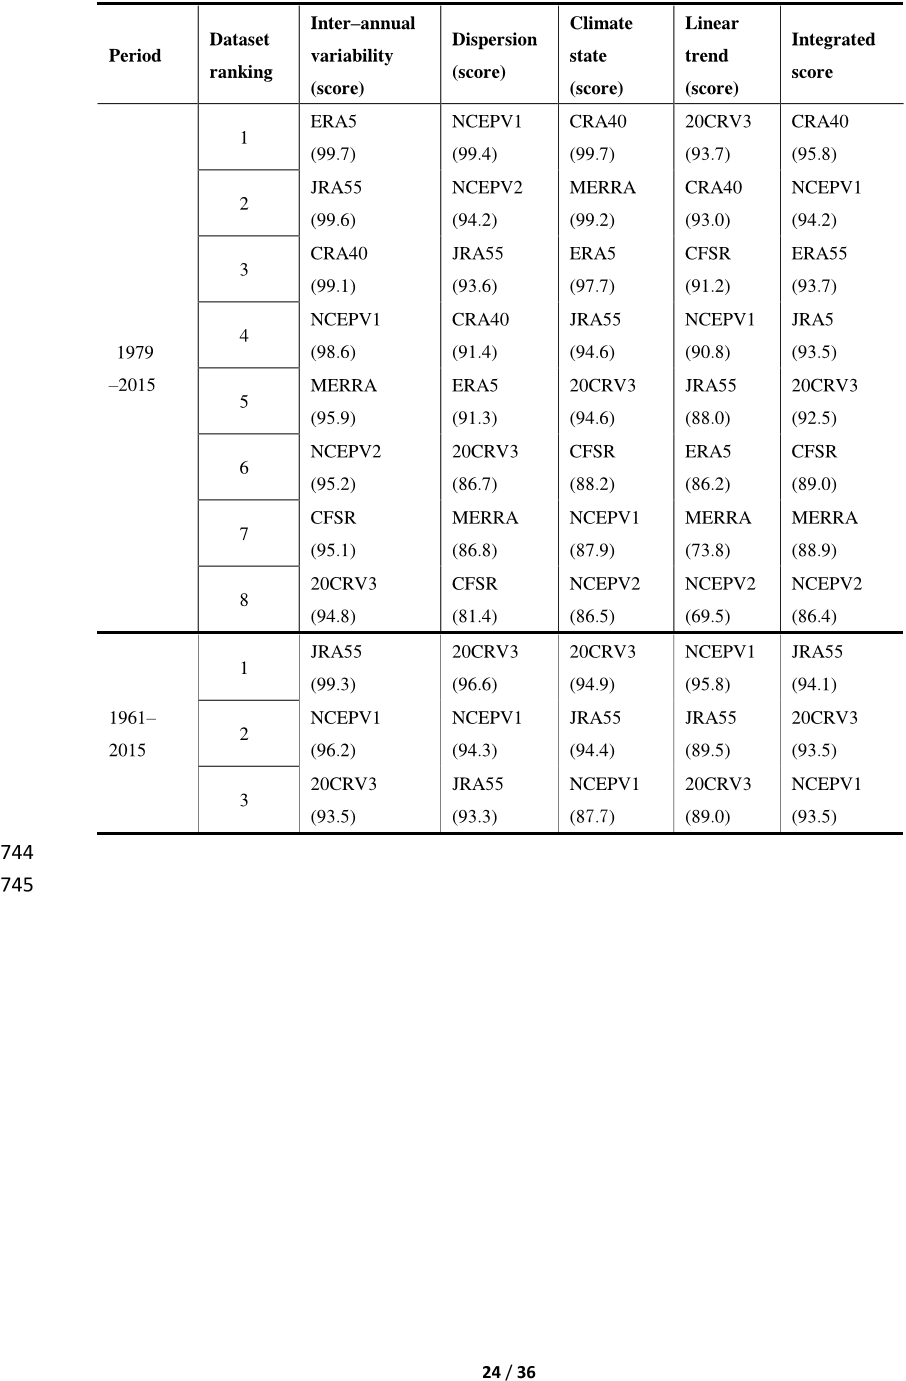
The integrated score of 469 20CRV3 was 92.5 and 93.5 during the periods of 1979–2015 and 1961–2015 respectively, with the 470 better performance than other REAs in linear trend (1979–2015), dispersion (1961–2015), and 471 climate state (1961–2015). 

Since these reanalyses have the disadvantages of incorporating the errors from 53 the numerical prediction models, the assimilation processes, and the observation systems 54 (Bengtsson et al., 2004a, 2004b; Zhao et al., 2010; Zhao et al., 2015), the reliability of the reanalysis 55 data needs to be proven on global and regional scales. 

In this study, the authors evaluate the applicability of the reanalysis data by using the urbanization 125 bias–adjusted observational data from 1961–2015 across mainland China. 

527 (4) The REA biases in correlation, standard deviation, climate state and linear trends generally 528 increase with increasing elevation of stations. 

The time series, correlation, standard deviation, 177 climate state, and linear trends of the reanalysis data are evaluated against the observations. 

The 512 cold biases of CRA40, NCEPV1 and JRA55 are mainly caused by the lower SAT in summer, 513 whereas those of NCEPV2, CFSR, and ERA5 are mainly caused by the lower winter mean 514 temperature.